React-Art and Bar Charts

Introduction
I've shown in the past how to utilize react-art and other libraries to do animations, and render arbitrary things. So now lets bring it all together, lets render a simple bar chart.
I'm going to leverage Paths.js because it was made for this exact reason. Given data, generate an immutable set of paths. Ultimately that is what visualizations are, a data set converted to a set of paths.
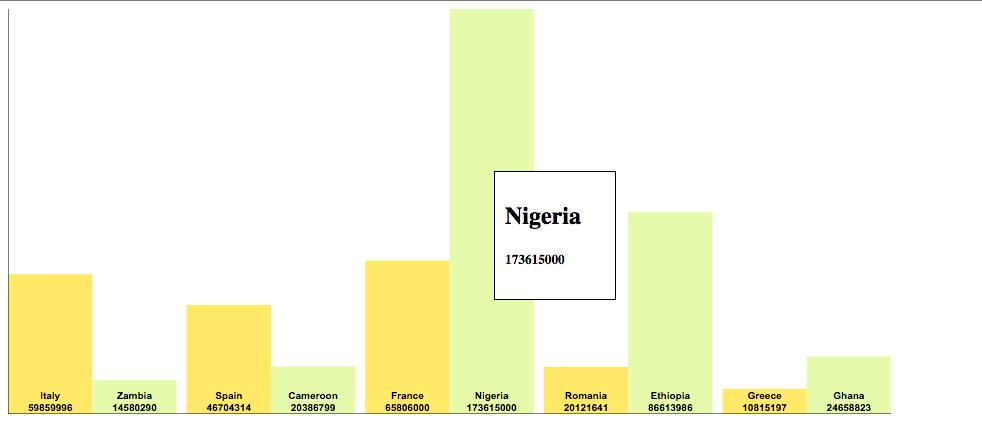
The end result will look something
Boilerplate
I like to setup a boilerplate template that just renders an arbitrary surface that is the full width of the viewport. Also to make things response we'll hook up some event listeners to the window resize and trigger a re-render.
We will bring in each side 100px and add a margin of 50px to each side to give us some padding on each side. Also note we should totally debounce the resize event on the window if this was production!
var React = require("react"),
  ReactArt = require("react-art"),
  Surface = ReactArt.Surface;

var viewportWidth = function () {
  return window.innerWidth - 100;
};
var viewportHeight = function () {
  return window.innerHeight - 100;
};

var Demo = React.createClass({
  getInitialState: function () {
    return {
      width: viewportWidth(),
      height: viewportHeight(),
    };
  },
  componentDidMount: function () {
    window.addEventListener("resize", this.refresh, false); //This should be debounced
  },
  componentWillUnmount: function () {
    window.removeEventListener("resize", this.refresh, false);
  },
  refresh: function () {
    this.setState({
      width: viewportWidth(),
      height: viewportHeight(),
    });
  },

  render: function () {
    var bar = this.getBar();

    return (
      <div style={{ margin: "50px" }} style={{ position: "relative" }}>
        <Surface width={this.state.width} height={this.state.height}></Surface>
      </div>
    );
  },
});

module.exports = Demo;
Data and the Chart
We need some data, so I'll steal some from the Paths.js wiki, and also steal the colors.
We'll add a method that returns a Bar Chart generated by Paths.js that is dervied from width/height we set on state.
A new Bar Chart will get called every time we call setState.
var data = [
    [
      { name: 'Italy', population: 59859996 },
      { name: 'Spain', population: 46704314 },
      { name: 'France', population: 65806000 },
      { name: 'Romania', population: 20121641 },
      { name: 'Greece', population: 10815197 }
    ],
    [
      { name: 'Zambia', population: 14580290 },
      { name: 'Cameroon', population: 20386799 },
      { name: 'Nigeria', population: 173615000 },
      { name: 'Ethiopia', population: 86613986 },
      { name: 'Ghana', population: 24658823 }
    ]
  ];

var colorPallete = ["#FEE871", "#E5FAAF"];


getBar: function() {

    var bar = Bar({
      data: data,
      accessor: function(x) { return x.population; }, // Value to use
      compute: {
        color: function(i) { return colorPallete[i]; } //Color of the bar
      },
      width: this.state.width, //Set it to our surface width so it is responsive when our surface width changes
      height: this.state.height, //Set it to our surface height so it's repsponsive
      gutter: 10
    });

    return bar;
}
Lets create the X/Y axis bars
The X axis and Y axis can be generated with straight lines by once again Paths.js Path method.
The X axis starts at the bottom left corner, so 0,height, and runs to the far right, so width,height.
The Y axis starts at the top right corner, so 0,0, and runs along the left side to the bottom so 0,height
We merely stroke a 1px black line.
getXAxis: function() {
    var path = Path().moveto(0, this.state.height).lineto(this.state.width, this.state.height);
    return (
        <Shape d={path.print()} strokeWidth={1} stroke="#000" />
    );
},
getYAxis: function() {
    var path = Path().moveto(0,0).lineto(0, this.state.height);
    return (
        <Shape d={path.print()} strokeWidth={1} stroke="#000" />
    );
},
render: function() {
        return (
            <div style={{margin:'50px'}} style={{position: 'relative'}}>
                <Surface
                    width={this.state.width}
                    height={this.state.height}
                >
                    <Group>
                        {this.getXAxis()}
                        {this.getYAxis()}
                    </Group>
                </Surface>
            </div>
        );
    }
Render the Bar Graph
We'll call this.getBar() to just generate one bar graph and then pipe it into each function that needs it.
To make this more testable we'd probably just want to provide each function with absolutely necessary info but just keep that in mind if you implement this for real.
All we do is map over each curve that we have, in our case we have 10 data points so therefore we have 10 curves.
The color comes from the way we grouped our data and the pallette we provided in the first step.
    getBarChart: function(bar) {
        return bar.curves.map(function(bar) {
            return (
                <Group>
                  <Shape d={bar.line.path.print()} fill={bar.color}/>
                </Group>
            )
        }, this)
    },
    render: function() {
        var bar = this.getBar();

        return (
            <div style={{margin:'50px'}} style={{position: 'relative'}}>
                <Surface
                    width={this.state.width}
                    height={this.state.height}
                >
                    <Group>
                        {this.getBarChart(bar)}
                    </Group>
                    <Group>
                        {this.getXAxis(bar)}
                        {this.getYAxis(bar)}
                    </Group>
                </Surface>
            </div>
        );
    }
Render the Bar Information
Lets also display some text about the bars. We'll use Text from react-art to do that.
We need to calculate a few points, which Paths.js will help us with.
Since each bar is a rectangle it just has 4 points, we can get the points from the path.
The path will gives us 4 arrays, each with x,y coordinates of each corner point.
We need to do a little subtraction of the x,y coordinates to figure out the width of each bar, and height of each bar so we can place our text.
We'll use the Group element from react-art to adjust our coordinate system to start at the top left of each bar.
The name and population will be aligned to the center, and at the bottom of the bar. We can use x,y coordinates to derive our width/height.
    getBarChart: function(bar) {
        return bar.curves.map(function(bar) {

            var points = bar.line.path.points(),
                right = points[0][0],
                top = points[0][1],
                left = points[2][0],
                bottom = points[2][1],
                width = right - left,
                height = bottom - top;

            return (
                <Group>
                  <Shape d={bar.line.path.print()} fill={bar.color}/>

                  <Group x={left} y={top}>
                    <Text x={width/2} y={height - 24} alignment="middle" fill="#000" font='bold 10px "Arial"'>{bar.item.name}</Text>
                    <Text x={width/2} y={height - 12} alignment="middle" fill="#000" font='bold 10px "Arial"'>{bar.item.population +''}</Text>
                  </Group>
                </Group>
            )
        }, this)
    },
Hover data for fun
Just to show how to handle mouse events we can have a mouseMove on each bar.
We'll bind each hover event with the item object which has the name and population.
When a new bar is hovered or the mouse is moved it will set the hoveredItem object and coordinates on our state which will cause a re-render.
Each movement of the mouse will cause a re-render so be sure and debounce this as well.
The hovered data displayed will actually use HTML not react-art since we wrap the Surface in a div and give it position:relative. This will mean it has the same coordinates as our Surface mouse events which is why we can just use x,y on the event.
    handleMouseMove: function(item, e) {
        this.setState({
            hoveredItem: item,
            hoveredY: e.y,
            hoveredX: e.x
        });
    },
    getBarChart: function(bar) {
        return bar.curves.map(function(bar) {

            var points = bar.line.path.points(),
                right = points[0][0],
                top = points[0][1],
                left = points[2][0],
                bottom = points[2][1],
                width = right - left,
                height = bottom - top;

            return (
                <Group
                  onMouseMove={this.handleMouseMove.bind(this, bar.item)}
                >
                  <Shape d={bar.line.path.print()} fill={bar.color}/>

                  <Group x={left} y={top}>
                    <Text x={width/2} y={height - 24} alignment="middle" fill="#000" font='bold 10px "Arial"'>{bar.item.name}</Text>
                    <Text x={width/2} y={height - 12} alignment="middle" fill="#000" font='bold 10px "Arial"'>{bar.item.population +''}</Text>
                  </Group>
                </Group>
            )
        }, this)
    },
    getHoveredData: function() {
        if (!this.state.hoveredItem) {
            return null;
        }
        return (
                <div style={{position: 'absolute', border: '1px solid #000', background: '#FFF', minWidth: '100px', padding:'10px', top: this.state.hoveredY, left:this.state.hoveredX}}>
                    <h2>{this.state.hoveredItem.name}</h2>
                    <h5>{this.state.hoveredItem.population}</h5>
                </div>
            )
    },
    render: function() {
        var bar = this.getBar();

        return (
            <div style={{margin:'50px'}} style={{position: 'relative'}}>
                <Surface
                    width={this.state.width}
                    height={this.state.height}
                >
                    <Group>
                        {this.getBarChart(bar)}
                    </Group>
                    <Group>
                        {this.getXAxis(bar)}
                        {this.getYAxis(bar)}
                    </Group>
                </Surface>
                {this.getHoveredData()}

            </div>
        );
    }
Final Code
Finally all the code combined.
var React = require("react"),
  ReactArt = require("react-art"),
  Surface = ReactArt.Surface,
  Group = ReactArt.Group,
  Text = ReactArt.Text,
  Shape = ReactArt.Shape,
  Bar = require("paths-js/bar"),
  Path = require("paths-js/path");

var viewportWidth = function () {
  return window.innerWidth - 100;
};
var viewportHeight = function () {
  return window.innerHeight - 100;
};

var data = [
  [
    { name: "Italy", population: 59859996 },
    { name: "Spain", population: 46704314 },
    { name: "France", population: 65806000 },
    { name: "Romania", population: 20121641 },
    { name: "Greece", population: 10815197 },
  ],
  [
    { name: "Zambia", population: 14580290 },
    { name: "Cameroon", population: 20386799 },
    { name: "Nigeria", population: 173615000 },
    { name: "Ethiopia", population: 86613986 },
    { name: "Ghana", population: 24658823 },
  ],
];

var colorPallete = ["#FEE871", "#E5FAAF", "#B7E5F5"];

var Demo = React.createClass({
  getInitialState: function () {
    return {
      width: viewportWidth(),
      height: viewportHeight(),
    };
  },
  componentDidMount: function () {
    window.addEventListener("resize", this.refresh, false); //This should be debounced
  },
  componentWillUnmount: function () {
    window.removeEventListener("resize", this.refresh, false);
  },
  refresh: function () {
    this.setState({
      width: viewportWidth(),
      height: viewportHeight(),
    });
  },
  getBar: function () {
    var bar = Bar({
      data: data,
      accessor: function (x) {
        return x.population;
      }, // Value to use
      compute: {
        color: function (i) {
          return colorPallete[i];
        }, //Color of the bar
      },
      width: this.state.width, //Set it to our surface width so it is responsive when our surface width changes
      height: this.state.height, //Set it to our surface height so it's repsponsive
      gutter: 10,
    });

    return bar;
  },
  handleMouseMove: function (item, e) {
    this.setState({
      hoveredItem: item,
      hoveredY: e.y,
      hoveredX: e.x,
    });
  },
  getBarChart: function (bar) {
    return bar.curves.map(function (bar) {
      var points = bar.line.path.points(),
        right = points[0][0],
        top = points[0][1],
        left = points[2][0],
        bottom = points[2][1],
        width = right - left,
        height = bottom - top;

      return (
        <Group onMouseMove={this.handleMouseMove.bind(this, bar.item)}>
          <Shape d={bar.line.path.print()} fill={bar.color} />

          <Group x={left} y={top}>
            <Text
              x={width / 2}
              y={height - 24}
              alignment="middle"
              fill="#000"
              font='bold 10px "Arial"'
            >
              {bar.item.name}
            </Text>
            <Text
              x={width / 2}
              y={height - 12}
              alignment="middle"
              fill="#000"
              font='bold 10px "Arial"'
            >
              {bar.item.population + ""}
            </Text>
          </Group>
        </Group>
      );
    }, this);
  },
  getXAxis: function (bar) {
    var path = Path()
      .moveto(0, this.state.height)
      .lineto(this.state.width, this.state.height);
    return <Shape d={path.print()} strokeWidth={1} stroke="#000" />;
  },
  getYAxis: function (bar) {
    var path = Path().moveto(0, 0).lineto(0, this.state.height);
    return <Shape d={path.print()} strokeWidth={1} stroke="#000" />;
  },
  getHoveredData: function () {
    if (!this.state.hoveredItem) {
      return null;
    }
    return (
      <div
        style={{
          position: "absolute",
          border: "1px solid #000",
          background: "#FFF",
          minWidth: "100px",
          padding: "10px",
          top: this.state.hoveredY,
          left: this.state.hoveredX,
        }}
      >
        <h2>{this.state.hoveredItem.name}</h2>
        <h5>{this.state.hoveredItem.population}</h5>
      </div>
    );
  },
  render: function () {
    var bar = this.getBar();

    return (
      <div style={{ margin: "50px" }} style={{ position: "relative" }}>
        <Surface width={this.state.width} height={this.state.height}>
          <Group>{this.getBarChart(bar)}</Group>
          <Group>
            {this.getXAxis(bar)}
            {this.getYAxis(bar)}
          </Group>
        </Surface>
        {this.getHoveredData()}
      </div>
    );
  },
});

module.exports = Demo;
Conclusion
Once again Paths.js comes in handy for generating arbitrary path information, and providing access to a lot of valuable data to making laying out your graphs with react-art a breeze.
Some homework for you is to add some vertical labels at each particular step.