Fundamentals of Rendering Data as an SVG Line with D3 and scaleLinear

Intro
Visualizations can be intimidating. We'll be focusing on the fundamentals. Nothing crazy, just drawing a line. We'll explain everything that goes into taking your data, rendering it and making sure it fits inside your SVG, and then we'll throw a little curve at the end.
Install Dependencies
First off D3 is the defacto standard for visualizations. It makes it easy to handle all the math, path building, etc and let React handle the rendering of it. We will use 2 packages from d3, the d3-shape library for building up our line path. Then the d3-scale that will handle the translation of our data to renderable numbers.
npm install d3-shape d3-scale
Data
Our data is structured specifically for this tutorial. The x is just increasing by 1 each time and the y is increasing by 50 each time. This will cause nice steps and will be easy to show off how the path structure is actually built and translated from our data.
export const data = [
  {
    x: 0,
    y: 0,
  },
  {
    x: 1,
    y: 50,
  },
  {
    x: 2,
    y: 100,
  },
  {
    x: 3,
    y: 150,
  },
  //...
  {
    x: 10,
    y: 500,
  },
];
Selectors
These are our data selectors, just JavaScript functions. These aren't special to D3 but it's what we'll use to select the piece of data for each x and y pointer.
const xSelector = (d) => d.x;
const ySelector = (d) => d.y;
Imagine if y wasn't your key but instead it was price. Well rather than d => d.y you'd have used d => d.price. That way you don't have to pre-process your data and add x or y properties, we just use some selectors to grab values for us.
Setup SVG
First off we'll define a width/height. When dealing with SVGs knowing the width/height is crucial. We're defining it as 500 wide and 300 high. This will give us the ability to scale our data down.
const width = 500;
const height = 300;
The outer wrapping <div> isn't necessary. The svg is given our width and height. We'll then place our svg paths inside of it.
return (
  <div>
    <svg width={width} height={height}></svg>
  </div>
);
scaleLinear
First off we need to import scaleLinear from d3-scale.
import { scaleLinear } from "d3-scale";
scaleLiner provides a way to create a range and a domain that are proportionally mapped. When give a value it has the ability to extrapolate in either direction. Mostly you are providing a value that is within the domain you have set. scaleLinear then extrapolates (fancy word for "does some math") and figures out what the output value is based on the range you've specified. Generally speaking the range will be the dimensions of the SVG you are rendering into.
The reason we need to scale our data is because the values of your data don't necessarily coordinate to actual rendering pixels. Our SVG is 500x300, but what if it were 800x500? Or 100x30? The data is still the same but we need to extrapolate where each data point should be rendered based on the size of our SVG.
To read more about scaleLinear you can see what the documentation says about it here d3-scale.
So for our xScale. We are rendering from 0 to the width of our SVG which is 500. Our domain of our data is the minimum x value and the maximum x value. The positions in the array for the range, coordinate to the positions of the domain.
So if you call xScale in this instance and give it the value 0. It will return your 0. If you call it with the value 10, it's going to return you the 500 aka the width. Now if you passed in 5 it will see that it is halfway between 0 and 10 in the domain, and extrapolating between 0 and 500 will return 250.
The x axis is the horizontal axis, and will help us position our rendering left < = > right.
const xScale = scaleLinear().range([0, width]).domain([0, 10]);
So you can see here that all this scaleLinear is doing is some math based upon your dimensions (range) and your data (domain). We've manually specified the array [0, 10] for our domain but this can be programmatically figured out using a min and or max function.
Now we're onto our y axis which is our vertical axis which will help us in our rendering top < = > bottom.
const yScale = scaleLinear().range([0, height]).domain([0, 500]);
Our data range for our y parameter extends from 0 to 500. So just like before we setup our domain based upon our data.
The range is setup based upon our height, which is 0 to 300 in this case.
For the x our data was easy it was numbers between 1 and 10. This is numbers between 0 and 500.
value => output
0 => 0
50 => 30
100 => 60
150 => 90
Our data is being scaled down this time to fit within the constraints of our 300 height.
Overall if you are rendering some graph data you'll likely use scaleLinear to map your domain values to the range values to render within your svg.
Build a Line
Now we need to build up our line. So we'll use the line function from d3-shape.
import { line } from "d3-shape";
We need to create a line and give an x and a y. What is going to happen is that our path that we create will eventually be given some data. Once it does it will loop over it and for each data point it called our x and y functions we specified.
Our x and our y first call their appropriate selectors. This will pluck off the value from each of our object structures that is structured like so { x: 1, y: 50}. Then we'll call our scaleLinear functions we setup. These will take the data value, and scale it to our renderable value. Then we'll return that to our line so it can figure out how we want our line created.
const path = line()
  .x((d) => xScale(xSelector(d)))
  .y((d) => yScale(ySelector(d)));
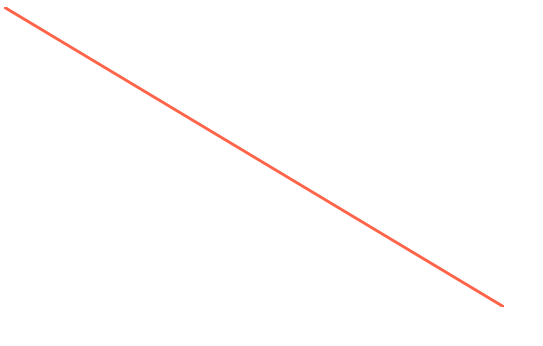
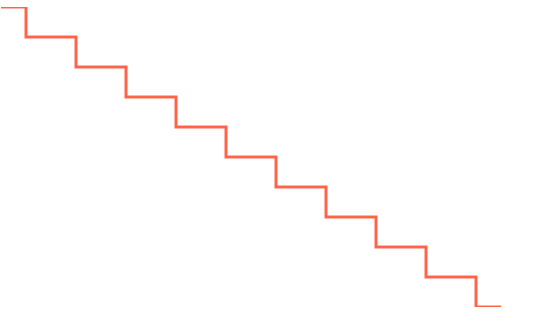
Finally we call it with our data, and it will render our line. Don't forget we need to give it a stroke of color, a strokeWidth which we set to 3, and tell it fill="none" otherwise it'll fill in with black.
return (
  <div>
    <svg width={width} height={height}>
      <path d={path(data)} stroke="#ff6347" strokeWidth={3} fill="none" />
    </svg>
  </div>
);
Path
If we take a look at what path(data) spits out it might be more clear about what's happening.
M0,0L50,30L100,60L150,90L200,120L250,150L300,180L350,210L400,240L450,270L500,300
Those values sure do look familiar! Hey those are the exact values we were figuring out in the scaleLinear section up above.
The first is an M which will move to our first position from our data0,0.
Then our next will draw a line to using L to our x and y. This is x=1 and y=50 in our data world. When mapped through our domain to our range it output 50,30. Rendering a line to the point x=50 and y=30.

Flip It
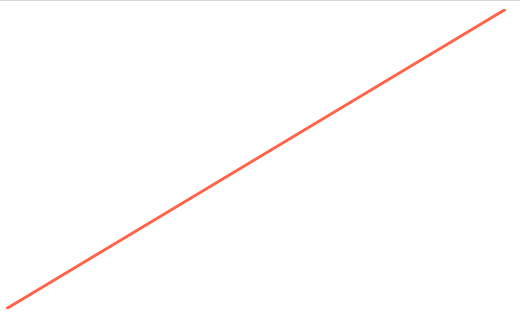
When dealing with graphing 0 is the bottom left corner. However when dealing with SVG 0 is the top left corner. That's why when we our rendering our values it's starting in the top left corner.
We told it via our domain and range that 0 should map to 0.
.range([0, height])
.domain([0, 500]);
Well if we wanted our 0 value to actually start at the bottom left corner we need to flip around range around.
So 0 value is actually mapped to our height aka the bottom left corner, and our maximum value is actually 0 the top right.
const yScale = scaleLinear().range([height, 0]).domain([0, 500]);
Up and Down Data
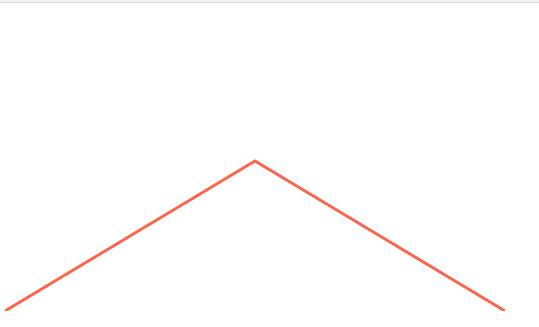
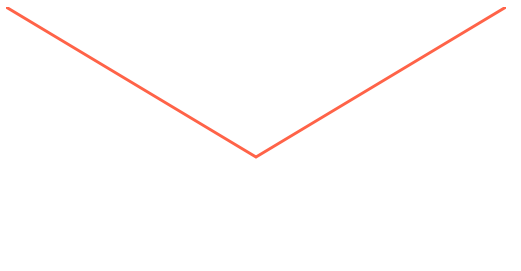
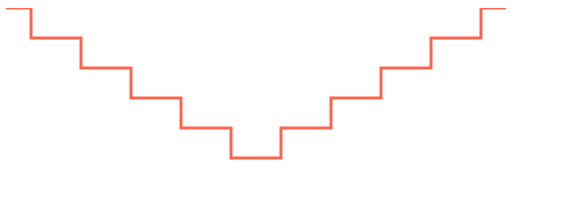
We can also render different data. Lets map a pyramid like route, it'll go up then down.
If you import the data
import { data as downUpData } from "./down_up";
It'll look like this.
{
    x: 3,
    y: 150,
  },
  {
    x: 4,
    y: 200,
  },
  {
    x: 5,
    y: 250,
  },
  {
    x: 6,
    y: 200,
  },
  {
    x: 7,
    y: 150,
  },
Rather than the straight line data we need to fix our path call to take in our downUpData.
<path d={path(downUpData)} stroke="#ff6347" strokeWidth={3} fill="none" />
You can see that the path we created was just instructions on how to render data. It wasn't tied to any specific data.
We can swap the data out and get a completely different result!
Now depending on what point you choose for your range either [0, height] or [height, 0] will change where it renders at.
Different Curves
One final note is you can specify how the data curves. This will instruct the line how to build out the actual path to render.
We need to import it from d3-shape along with our line.
import { line, curveStep } from "d3-shape";
Then rather than just an x and a y we supply a curve. This will give a function that will effect how the final output path is constructed.
const path = line()
  .x((d) => xScale(xSelector(d)))
  .y((d) => yScale(ySelector(d)))
  .curve(curveStep);
You can see here there are a few more instructions compared to the previous path.
M0,0L25,0L25,30L75,30L75,60L125,60L125,90L175,90L175,120L225,120L225,150L275,150L275,120L325,120L325,90L375,90L375,60L425,60L425,30L475,30L475,0L500,0
Ending
Change around the width/height, see how the path is effected, see what it does to your line and how it renders.