Add Interactivity to a Line Graph using scaleLinear.invert to Find a Data Point to Highlight on Mouse Move

Intro
Rendering data is only half the battle. To create a more engaging visualization we need to turn mouse movement/touches back into data so users can interact with and explore your data.

Setup
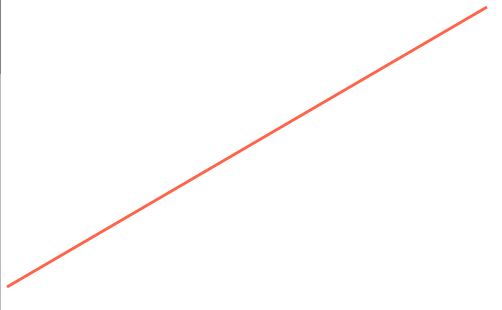
We're going to start with a basic line graph already setup.
import React, { Component } from "react";
import { line } from "d3-shape";
import { scaleLinear } from "d3-scale";
import { data } from "./data";

const width = 500;
const height = 300;

const xSelector = (d) => d.x;
const ySelector = (d) => d.y;

const xScale = scaleLinear().range([0, width]).domain([0, 10]);

const yScale = scaleLinear().range([height, 0]).domain([0, 500]);

class App extends Component {
  render() {
    const path = line()
      .x((d) => xScale(xSelector(d)))
      .y((d) => yScale(ySelector(d)));

    return (
      <div>
        <svg width={width} height={height}>
          <path d={path(data)} stroke="#ff6347" strokeWidth={3} fill="none" />
        </svg>
      </div>
    );
  }
}

export default App;

Add Padding
We will eventually be rendering some points to highlight data. These points will have a radius that may cause them to overflow outside of our svg container. So to ensure everything is visible we adjust our scales. Our data domain still stays the same but we apply a padding to our output range. Our width/height of our SVG stays the same but we add some minimal constrains to our range.
const padding = 10;

const xSelector = (d) => d.x;
const ySelector = (d) => d.y;

const xScale = scaleLinear()
  .range([padding, width - padding])
  .domain([0, 10]);

const yScale = scaleLinear()
  .range([height - padding, padding])
  .domain([0, 500]);
Render Points
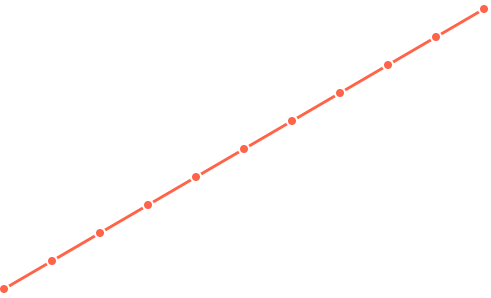
We will render each point separately. We loop over our data and use the same scale and selector pattern to get each x and y points. We use the circle svg element which requires a free props. The styling ones are the stroke, strokeWidth and fill. The stroke is set to white which will add a border to cover up the line running underneath it. Which will provide an additional way to highlight each data point.
<div>
  <svg width={width} height={height}>
    <path d={path(data)} stroke="#ff6347" strokeWidth={3} fill="none" />
    {data.map((d, i) => {
      const yPoint = yScale(ySelector(d));
      const xPoint = xScale(xSelector(d));
      return (
        <circle
          cx={xPoint}
          cy={yPoint}
          r={5}
          stroke="#fff"
          strokeWidth={2}
          fill="#ff6347"
        />
      );
    })}
  </svg>
</div>
The r refers to the radius of the circle. Rather than an x and a y the circle element uses cx and cy. This will set the coordinates for the center point to position the circle element.

Scale Invert + Mouse Move + Highlight
Now we need to use our mouse movements to convert a coordinate back into one of our data points. We want to capture all movements so we just attach them to the root svg element. If you attached them to each circle you'd have to hover right over it to highlight the data point.
<svg width={width} height={height} onMouseMove={this.onMouseMove}>
There are a few ways to do this, however one reason for using invert method is it is already built into the scale you've setup. Therefore it will respect any domain/range, as well as any other parameter you've setup correctly.
Not only that you could take the same point, pass it through to multiple scales and cross reference points across data sets. The point that it returns will not be rounded, it will be the interpolated data point. This could be used to create smoother interactions. Furthermore you can determine cut off points of when you could/should focus on a separate data point.
onMouseMove = (e) => {
  const index = Math.round(xScale.invert(e.clientX), 0);
  this.setState({
    selected: index,
  });
};
That's what we do here, we take our e.clientX and use the round method. So if you are below .5 it will round downwards, or if you are .5 and above it will round up to the next data point. You won't need to be hovering over the exact point for us to detect what we want to highlight.
For the record e.clientX is only working because the position of our SVG is in the top left corner of the screen. The .invert method will work from the range back to returning the data point in the domain. Normally when a scale is called it works from the domain to return you a range point to render.
This only works currently because our x values map directly to the index of the data. If we wanted to work with data that didn't map directly to an index we would need to use d3-array#bisect
So if you implement this you'll need to take into account the current position of the SVG to get the relative point and further more understand your range and how the value you're passing to .invert will translate. We aren't going to adjust it because it's minor, but we've add some padding to our range, we would technically need to take that into account when calling our .invert function.
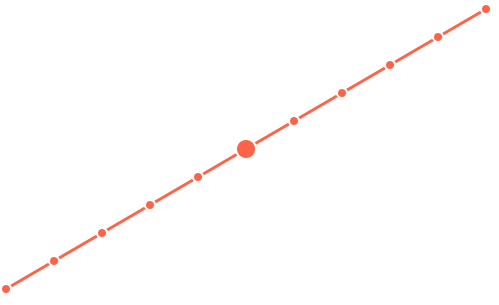
Finally we want to adjust our point radius if our users have selected a point. So we check if our index is equal to the selected point. If it is we use a radius of 10, else we use 5.
const r = this.state.selected === i ? 10 : 5;
return (
  <circle
    cx={xPoint}
    cy={yPoint}
    r={r}
    stroke="#fff"
    strokeWidth={2}
    fill="#ff6347"
  />
);

Ending
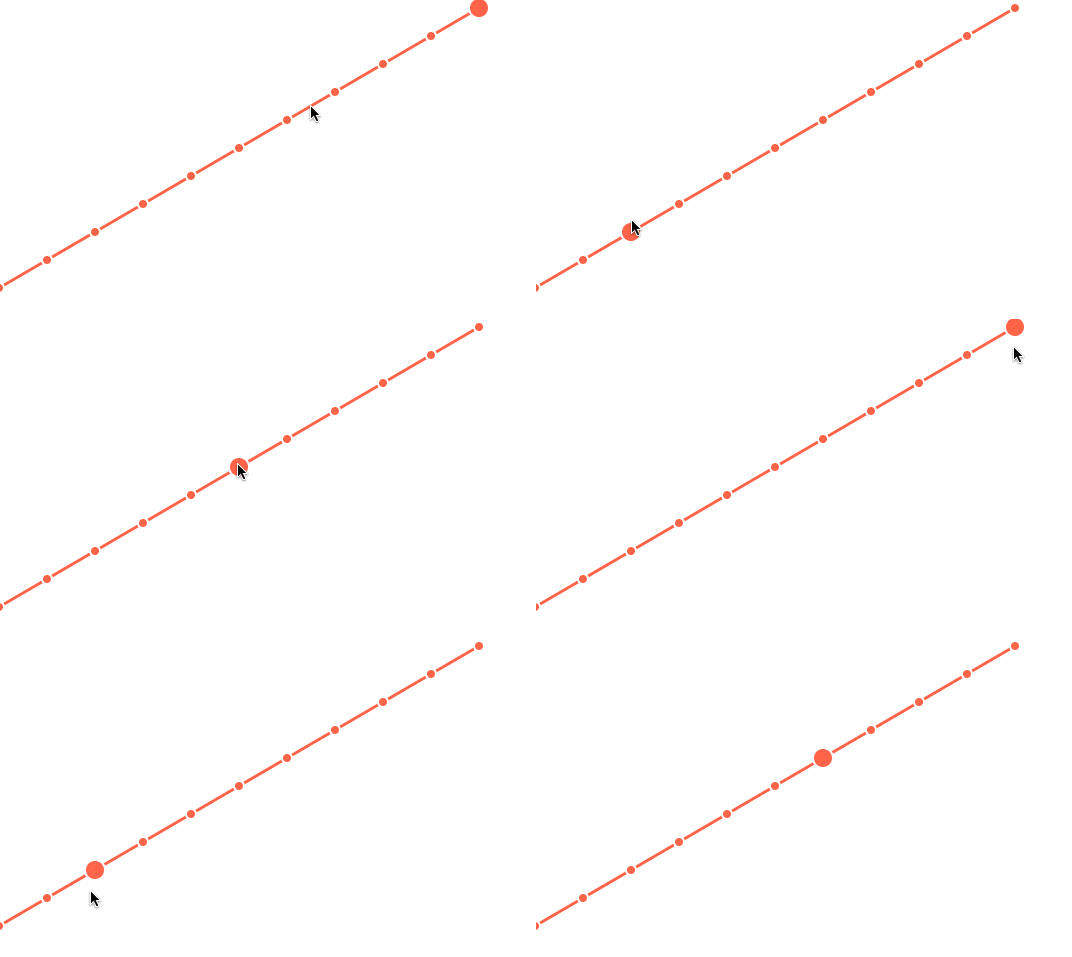
Now with the interactivity we can move our mouse around, and translate the coordinate into a data point.
