Create a Line Graph with Hovering to Render a Dual Line Highlight using VX and D3

Intro
We'll be using VX to abstract away a little bit of the tedious work that D3 makes us do.
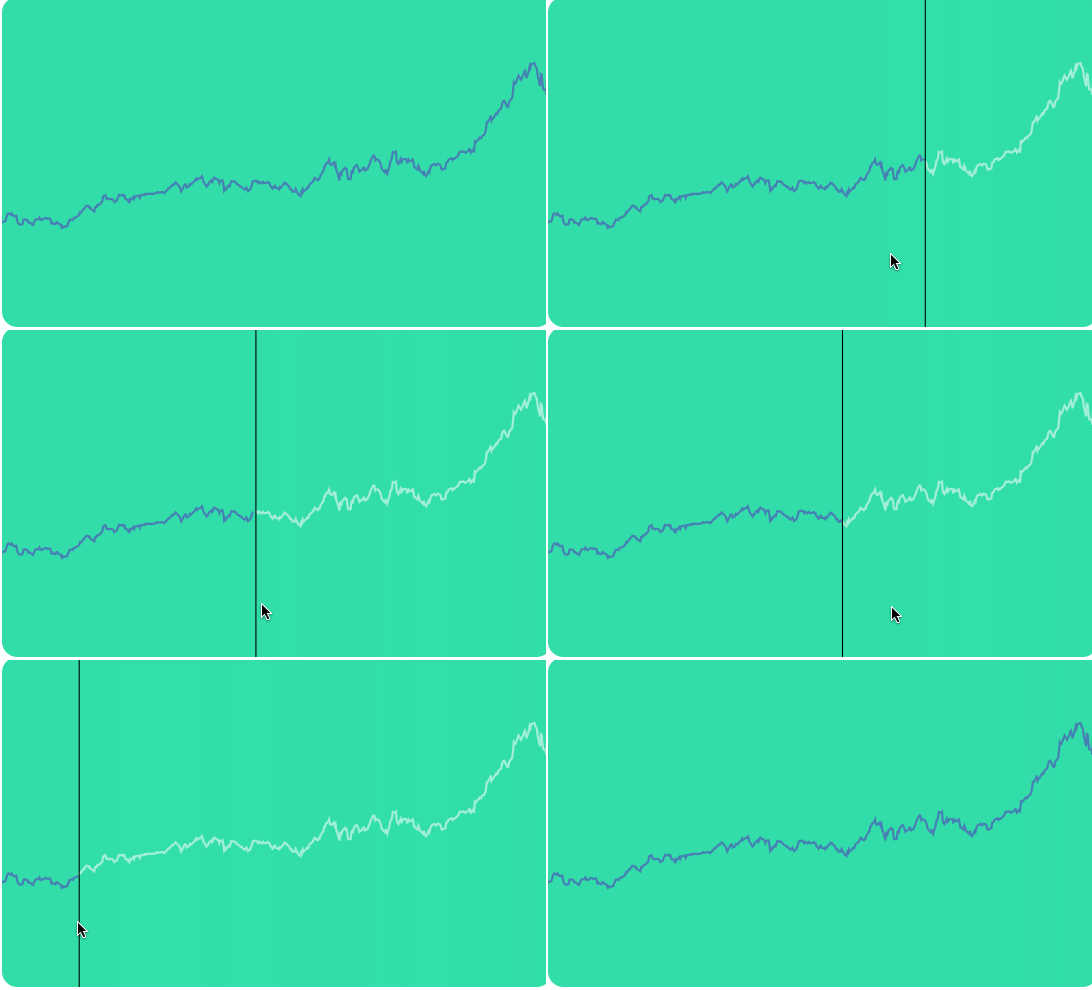
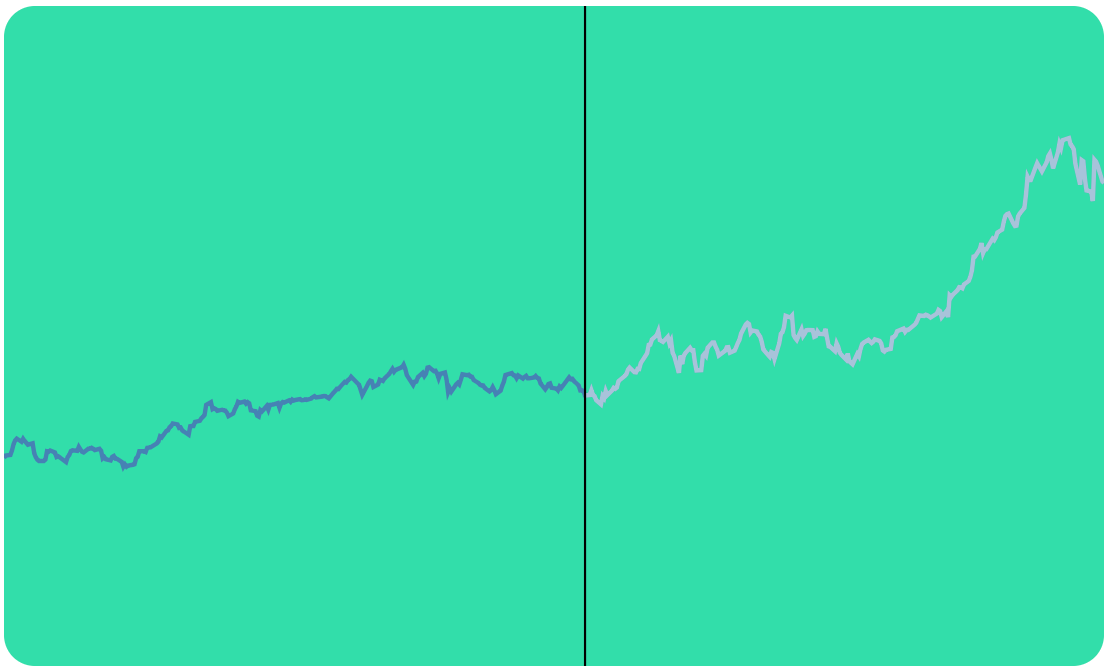
We're going to be building a graph that displays prices, in our cases mock data of apple stock prices. A user can move their mouse over the graph and a line will appear, as well as appear to split the line right in half. This will highlight the area that the user is potentially interested in seeing. This may not be an entirely useful feature but it's going to demonstrate some simple techniques.

Setup
We're going to kick this off with the graph bit already setup but I'll walk us through the code.
Lets look at our imports
import React, { Component } from "react";
import { LinePath, Line, Bar } from "@vx/shape";
import { appleStock } from "@vx/mock-data";
import { scaleTime, scaleLinear } from "@vx/scale";
import { localPoint } from "@vx/event";
import { extent, max, bisector } from "d3-array";
We import a few shapes from @vx/shape which just proxy some calls to D3 and make dealing with rendering the underlying SVG a breeze.
Then we import mock data to use, and also scaleTime and scaleLinear. These also proxy a few calls to d3-scale so we don't have to chain, instead we just provide an object.
The localPoint from @vx/event will allow us to get coordinate positions relative to the SVG. Otherwise our coordinates would be for the screen and we wouldn't be able to detect our drags correctly.
Finally we grab a few bits from d3-array to help us out.
const stock = appleStock.slice(800);

const xSelector = (d) => new Date(d.date);
const ySelector = (d) => d.close;
const bisectDate = bisector(xSelector).left;
We grab our stock data, and setup to functions that are just selectors for data. When given a value from stock it will select and create the appropriate x/y values that our system expects.
Finally our bisectDate uses bisector, we'll get into this later but it'll help us determine the exact index that the user is mousing over
Then in our render we need to setup a few scales to deal with our data. The width and height are purely arbitrary it's just some values that I picked
render() {
    const width = 500;
    const height = 300;

    const xScale = scaleTime({
      range: [0, width],
      domain: extent(stock, xSelector),
    });

    const yMax = max(stock, ySelector);

    const yScale = scaleLinear({
      range: [height, 0],
      domain: [0, yMax + (yMax / 4)],
    });
}
Lets dissect each of these scales. The first is scaleTime.
We provide it a range, this is the range of the pixels. We want to map out data values and scale them to fit into the range of [0, 500].
Our domain is our data. We use the extent method and pass it our xSelector. It will loop over each of our data points and eventually return an array.
That array will be [earliestDate, latestDate]. So our earliest date will map to position 0 on screen and our latest date will map to pixel 500.
const xScale = scaleTime({
  range: [0, width],
  domain: extent(stock, xSelector),
});
Then our yScale we construct the scale ourself rather than using extent. The reason we do this is so we can add a bit of padding.
If we don't add some padding via the yMax / 4 then our maximum data point will be positioned right at the top of the screen.
Which brings me to our range you can see it's swapped form our xScale. The height comes first and then the 0. That's because the 0 point which when you look at a graph visually is technically on top, and the bottom of the graph is at the full height of the graph.
So when our stock has a 0 value it will map to render at the height of the SVG and thus be at the bottom.
const yMax = max(stock, ySelector);

const yScale = scaleLinear({
  range: [height, 0],
  domain: [0, yMax + yMax / 4],
});
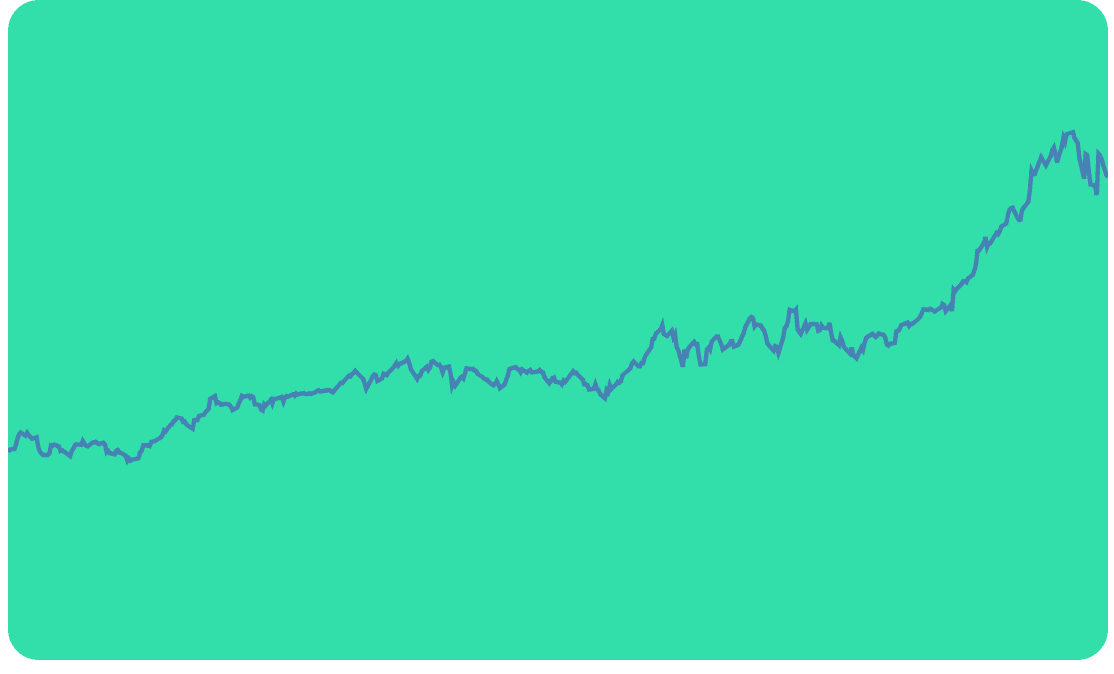
Finally we render it all, you can see here we have a rect that is just a color and covers the whole width/height of the SVG. Then we also add in a LinePath from @vx/shape. This takes our data, our scales, and then how it should go about selecting our data so we give it our xSelector and ySelector.
class App extends Component {
  state = {
    position: null,
  };
  render() {
    const width = 500;
    const height = 300;

    const xScale = scaleTime({
      range: [0, width],
      domain: extent(stock, xSelector),
    });

    const yMax = max(stock, ySelector);

    const yScale = scaleLinear({
      range: [height, 0],
      domain: [0, yMax + yMax / 4],
    });

    return (
      <svg width={width} height={height}>
        <rect
          x={0}
          y={0}
          width={width}
          height={height}
          fill="#32deaa"
          rx={14}
        />
        <LinePath
          data={stock}
          xScale={xScale}
          yScale={yScale}
          x={xSelector}
          y={ySelector}
          strokeWidth={2}
        />
      </svg>
    );
  }
}

export default App;

Add Mouse Movements
Now the next thing we need to do is add mouse movements. This will require 2 things. One a thing to attach the movements too, and then a function to handle the dragging.
This might look like a lot but it's just creating a rect in the background. You can see we created a rect right up above. This is partly unnecessary to use Bar from VX. The reason we could is how it handles any touch/mouse event it will inject the data into it. You may have some abstractions that don't give you access to the data that the Bar actually has access to. So it can help when building out abstractions.
Also because you have created the scales in our render function we need to pass them along, otherwise we won't be able to figure out the necessary stuff.
<Bar
  x={0}
  y={0}
  width={width}
  height={height}
  fill="transparent"
  rx={14}
  data={stock}
  onTouchStart={(data) => (event) =>
    this.handleDrag({
      event,
      data,
      xSelector,
      xScale,
      yScale,
    })}
  onTouchMove={(data) => (event) =>
    this.handleDrag({
      event,
      data,
      xSelector,
      xScale,
      yScale,
    })}
  onMouseMove={(data) => (event) =>
    this.handleDrag({
      event,
      data,
      xSelector,
      xScale,
      yScale,
    })}
  onTouchEnd={(data) => (event) => this.setState({ position: null })}
  onMouseLeave={(data) => (event) => this.setState({ position: null })}
/>
We'll keep it as a bar but you could just as easily say. You'll notice we need to pass in stock as data, and remove the 2 arrow functions to just the one.
<rect
  x={0}
  y={0}
  width={width}
  height={height}
  fill="transparent"
  rx={14}
  onTouchStart={(event) =>
    this.handleDrag({
      event,
      data: stock,
      xSelector,
      xScale,
      yScale,
    })
  }
  onTouchMove={(event) =>
    this.handleDrag({
      event,
      data: stock,
      xSelector,
      xScale,
      yScale,
    })
  }
  onMouseMove={(event) =>
    this.handleDrag({
      event,
      data: stock,
      xSelector,
      xScale,
      yScale,
    })
  }
  onTouchEnd={(event) => this.setState({ position: null })}
  onMouseLeave={(event) => this.setState({ position: null })}
/>
Here is the tough par to understand but is key. We take our event and pass it through localPoint to get a point that is transformed relative to the x/y of the SVG rather than the whole screen.
const { x } = localPoint(event);
Our xScale not only can convert a data point to a screen renderable pixel but also do the reverse. So we call xScale.invert with our coordinate from the event. This will return an approximate date based on the range.
const x0 = xScale.invert(x);
Now we need to figure out from our date what exact index we are possibly at. bisectors make this easier to deal with.
We pass our data, our approximate date from our invert, and then a minimum returned index of 1.
let index = bisectDate(data, x0, 1);
With our index we can determine our 2 pieces of data. Either the current index or the previous index. We don't want to go below 0 index so that's why our bisectDate was set at a minimum of 1.
Now we need to figure out which point we're closest to. In our case we take our position, then use our xSelector on each point. This will return a Date.
When dates are used in math they get converted to their unix timestamp integer form.
We can now determine which data point we are at, and also importantly what index we are at.
const d0 = data[index - 1];
const d1 = data[index];
let d = d0;
if (d1 && d1.date) {
  if (x0 - xSelector(d0) > xSelector(d1) - x0) {
    d = d1;
  } else {
    d = d0;
    index = index - 1;
  }
}
Armed with our index and our data point we're closest to we'll do a setState.
We need to pass our data point into our xSelector and xScale which will give us an x position to render our line so the user can see what's going on.
Converting to a point to render can technically be put in the render function and we could just do a setState with the index but I'm doing it this way slightly arbitrarily.
this.setState({
  position: {
    index,
    x: xScale(xSelector(d)),
  },
});
All of it put together.
handleDrag = ({ event, data, xSelector, xScale, yScale }) => {
  const { x } = localPoint(event);
  const x0 = xScale.invert(x);
  let index = bisectDate(data, x0, 1);
  const d0 = data[index - 1];
  const d1 = data[index];
  let d = d0;
  if (d1 && d1.date) {
    if (x0 - xSelector(d0) > xSelector(d1) - x0) {
      d = d1;
    } else {
      d = d0;
      index = index - 1;
    }
  }

  this.setState({
    position: {
      index,
      x: xScale(xSelector(d)),
    },
  });
};
Render a Line
Now we've got our position we need to render a Line. We check if our position exists as it's undefined when we aren't hovering.
Then pass our from and to objects. These define 2 points to render a line between. We're rendering a straight line up and down at a certain X coordinate.
So our x will be the same in both from and to, then our y will be the top/bottom of our SVG.
{
  position && (
    <Line
      from={{ x: position.x, y: 0 }}
      to={{ x: position.x, y: height }}
      strokeWidth={1}
    />
  );
}
Render another LinePath
Now comes the point where we need to render another line to highlight the part of the line the user cares about. Your first instinct might be to create new scales (mine was), but what we actually want to do is just slice our data.
The scales we created are already configured to render our data. In normal cases we just pass all the data to render the full line. But we don't have to start from rendering at 0 we can render any data. As long as it matches the domain we setup it'll map to our range correctly.
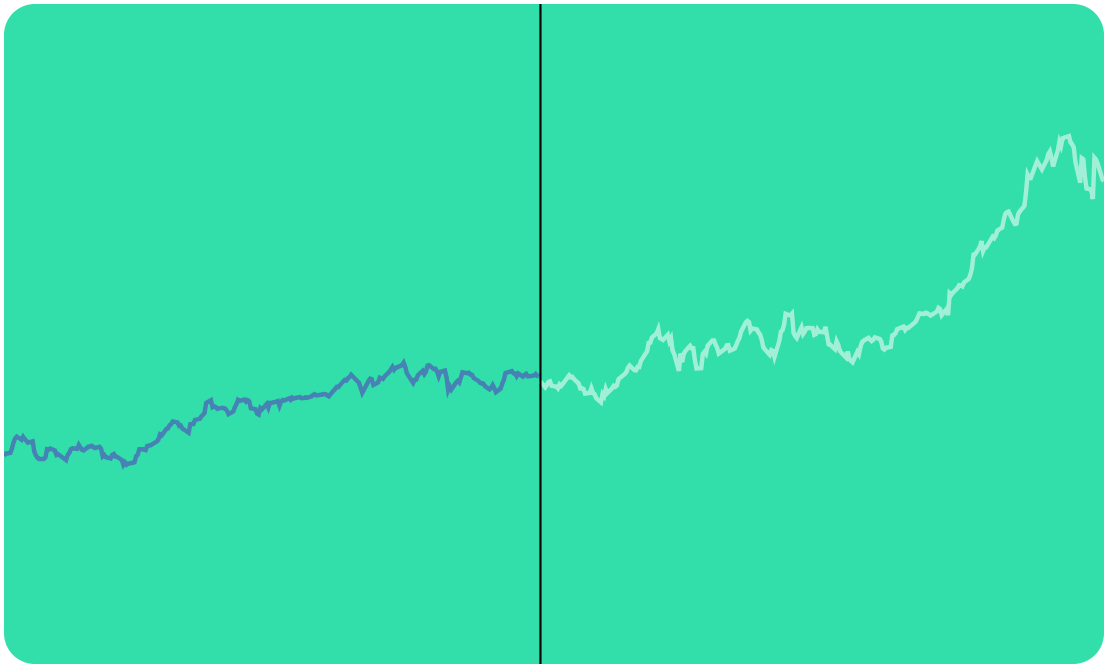
So we pass in our data but we do a slice. This will cut the data from that index to the end of the array. So we'll start our rendering of our line right at the index. We'll now be rendering a line with .5 opacity right over the other LinePath that's our full data.
{
  position && (
    <LinePath
      data={stock.slice(position.index)}
      xScale={xScale}
      yScale={yScale}
      x={xSelector}
      y={ySelector}
      strokeWidth={2}
      stroke="rgba(255,255,255,.5)"
    />
  );
}

Split the Lines
Now that we're rendering one line on top of the other lets see what it's like to "split" the line. We don't actually split anything we just render 2 lines.
We split the data from 0 to the index that the user has their mouse at.
<LinePath
  data={position ? stock.slice(0, position.index) : stock}
  xScale={xScale}
  yScale={yScale}
  x={xSelector}
  y={ySelector}
  strokeWidth={2}
/>
Then when we aren't hovering we render the full line.

Ending
There you have it, you can now hover over the SVG and cause 2 lines to be drawn and split it. You could use this to set 2 posts and render 3 lines, and show statistics about the data the user has constrained. The key parts are understanding that scales will respond to data correctly, so manipulate the data and not the scales and rendering what you want becomes easier.
